Indicators
To assess the impacts of transport policies and scenarios the model estimates a set of quantitative indicators related to different domains: transport, environment, economy.
Indicators are calculated by MOMOS on yearly basis over 30 years for two different scenarios at the same time, designed independently selecting specific set of policies. By analysing the indicators, it is possible to evaluate how the performance of the transport system could be improved, to design comprehensive strategies checking at the same time the impacts on environment and safety, while considering the overall cost of implementation and from the user perspective.

Transport

Environment

Economy
Transport indicators
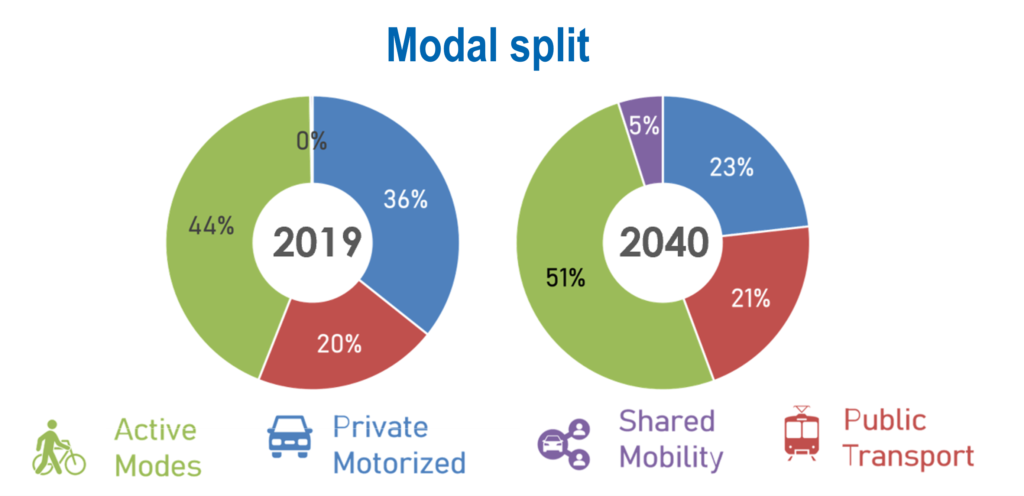
MOMOS simulates urban mobility by transport mode for both passengers and freights segments. Several indicators are estimated for each scenario, to provide details on the evolution lifestyles, transport choices and mobility patterns. On the passenger side, one of the main indicators is modal split, computed both on trips and passenger-km and distinguishing the following modes: cars, motorcycles, bikes, walking, public transport (tram, bus, metro), and shared mobility (cars, bikes, moped, micromobility). On the freight side, indicators such as vehicle-km travelling in the urban area are segmented by Light Duty Vehicle (LDV), Heavy Duty Vehicle (HDV), and cargo-bikes .
Other transport indicators are related to passenger trips and passenger-km by mode, motorisation rate, average and total travel time, vehicle fleet composition by fuel technology, road accidents and fatalities, etc.
These indicators are related to mobility within the urban area, but also include – or are affected by – the urban segment of the incoming trips from surrounding areas. This aspect is particularly relevant for municipalities within dense metropolitan or urbanised areas, where the amount of ‘city users’ is largely contributing to urban mobility. As an example, the urban segment of Park & Ride users influences trips by public transport and sharing mobility services.
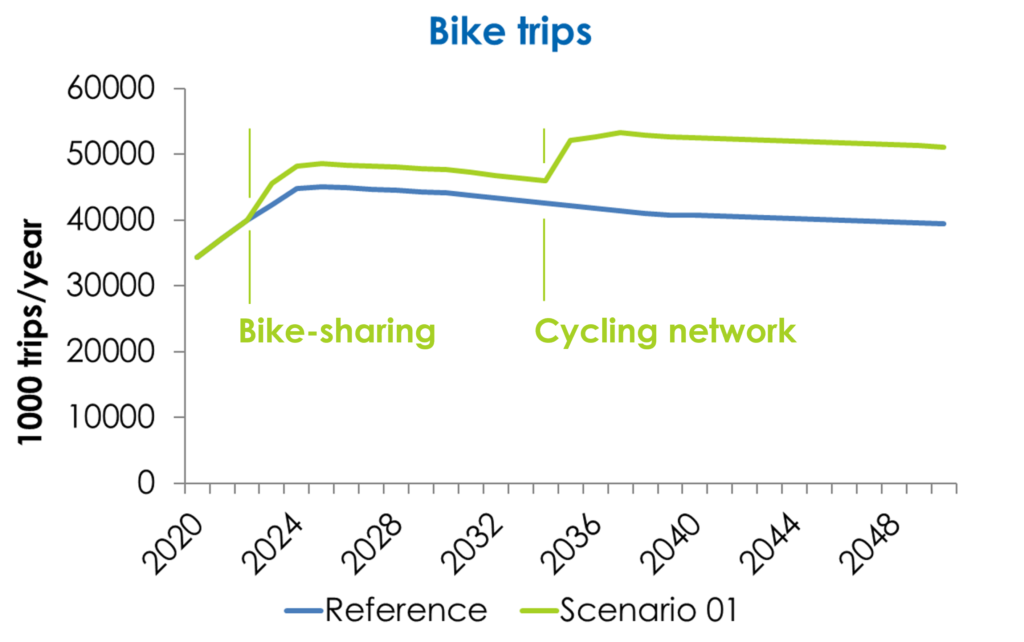
All the indicators are computed on a yearly basis, so it is possible to appreciate the impact of urban policies implemented in different years. It is also highlighted that, when combined, policies affecting the same variables in the model can reduce or amplify the impact with respect to the case in which the policy is applied in isolation. For example, an increase of a cycling network would be beneficial and support the impact of expanding bike sharing services. Also, there is a correlation between public transport services and car sharing, due to their competition and attractiveness for similar passenger segments.
Environmental indicators
In many urban areas, road traffic remains one of the main sources of air pollutant emission. On a larger scale, the transportation sector is responsible for about a quarter of EU GHG emissions, including activity at urban scale. With this respect, MOMOS allow to explore impacts in terms of several environmental indicators.
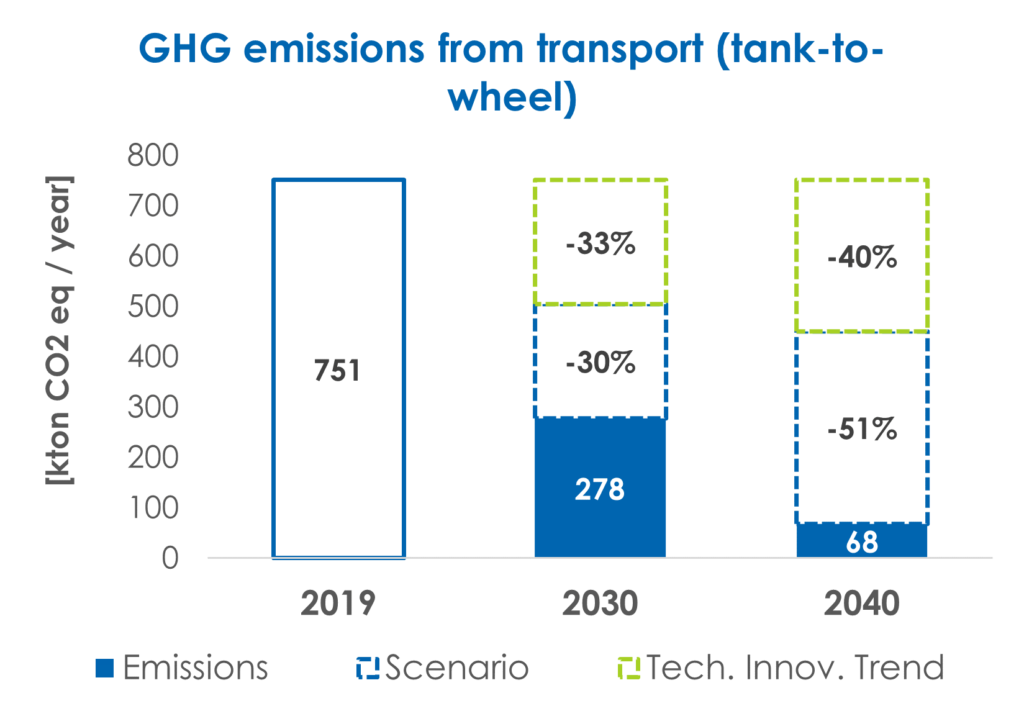
The main indicator is related to carbon dioxide emissions, crucial to assess the pathway toward climate neutrality in urban context. Both tank-to-wheel and well-to-wheel emissions are estimated in the model. Additionally, air pollutants emissions are estimated considering their harmful impacts on citizens’ health, namely PM2.5 and PM10 (Particulate Matter), NOx (Nitrogen Oxides), VOC (Volatile Organic Compound) and CO (Carbon Monoxide). The exhaust component is estimated, as well as emissions from vehicle tyre, brake wear and surface wear for particulate matter.
The estimation is based on both vehicle fleet composition by fuel technology and transport performances in terms of vehicle-km by mode, with the application of specific emission factors and fuel consumption factors. Energy consumption segmented by electric energy and fossil fuels is estimated and Greenhouse gas emissions (CO2 equivalent) is derived, applying the related carbon content by fuel / energy. Moreover, the model allows to investigate emissions by mode, to design an efficient and targeted strategy for their reduction.
Economy indicators
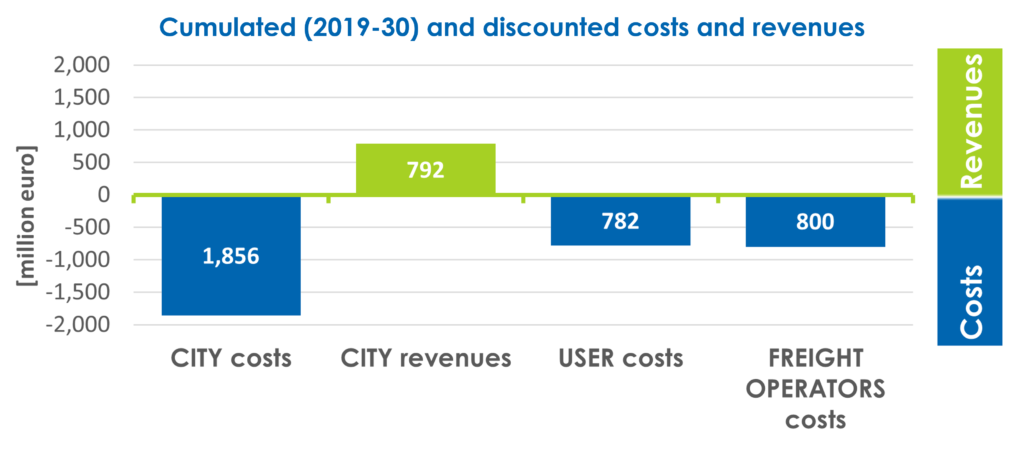
For each urban mobility policy, costs (and revenues if relevant) are estimated, considering both their implementation and management phase. Therefore, the model allows to understand the overall costs and revenues for each scenario simulated. Usually, costs are computed on a yearly basis and cumulated over the simulation period, discounted over time, and compared to a reference scenario.
Different actors are considered when estimating the indicators related to costs. As far as city authority is concerned, both costs and revenues are estimated, to take into account on one hand maintenance and implementation costs, and on the other hand the revenues resulting from some services provided (parking pricing, public transport ticket, congestion and pollution charging accesses, etc.). Expenditures of passenger transport users are also estimated, considering the cost for transport services but also related to private car ownership (fuel, taxation, purchase, etc.). A similar approach is used for the freight operators.
Finally, the model includes the monetisation of externalities (CO2 emissions, air pollutant emissions, noise, and injury accidents), to support the overall evaluation of scenarios to undertake considering the total costs and revenues.
MOMOS supports the analysis of
pathways towards sustainable urban mobility
The MOMOS model is developed and applied by TRT Trasporti e Territorio.
Contact us to explore the potentiality of this tool.