The MOMOS model
MOMOS (Sustainable MObility MOdel) is an assessment tool that offers support to analyse different policies for sustainable mobility in urban areas. It can be adapted to different urban contexts (depending on the city size) and to Italian or European geographic areas. Currently, the model can be applied to urban areas in the EU27 Member States, the United Kingdom, Norway or Switzerland.
Developed in MS Excel, it requires less data and can be applied within much shorter times and at lower costs in comparison with traditional simulation models.
MOMOS allows city administrations to make a quick scan between alternative hypotheses of intervention providing the orders of magnitude of the needed resources and expected impacts on yearly basis. The model is able to provide 30 years of simulation, e.g. for the period from 2020 to 2050.
MOMOS does not intend to replace sophisticated transport models, but allows for an evaluation of alternative solutions that is:

Strategic

Quantitative

Theoretically sound

Adaptable to a specific context

Adaptable for limited time and resources
How MOMOS works?
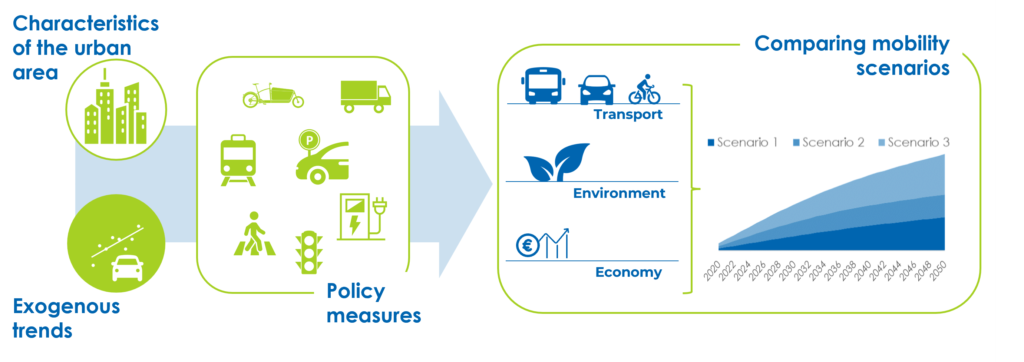
The model provides estimations of mobility trends in urban areas quantifying transport, environmental and economic impacts of transport policy measures over time.
To represent the urban characteristics at the base year, as well as the exogenous trends in place outside of the scope of urban policies, MOMOS requires a set of input data to reproduce specific city circumstances, related to socio-demographic aspects as well as mobility features (public transport infrastructure, innovative services, parking, traffic management solutions, etc.). MOMOS allows to evaluate different urban mobility policy measures, defining their intensity and temporal dimension. Policy measures can be simulated individually or can be used to build policy packages and scenarios activating multiple measures. The model allows to simulate at the same time different scenarios, designed independently, to be used for comparison purposes.
To assess the impacts of mobility scenarios, the model estimates a set of output indicators, concerning transport (modal split, vehicle fleet evolution, car ownership, road fatalities, etc.), environment (air pollutant and GHG emissions, energy consumption, etc.), and economy (cost and revenues for the city, monetization of externalities, etc.).
MOMOS is an aggregated model, but is customizable according to the city being considered. To properly represent the city’s characteristics at base year, the MOMOS tool requires a comprehensive set of input data. Input data retrace, in the most accurate way possible, the city circumstances, including both socio-demographic aspects, and of course all urban mobility features. The collected input data include: population (age structure, growth, spatial distribution, etc.), urban mobility features (motorization rate, modal split, incoming trips, freight share, etc.), transport infrastructure (bike lanes, e-charging stations, Park & Ride, etc.), public transport (offer, ticket price, cost, speed, network length, prioritizing systems, etc.), parking (number of slots, tariff, etc.), sharing mobility (carsharing, bike sharing, moped sharing, micromobility), traffic control and management (LTZ passenger/freight, LEZ passenger/freight, pedestrian areas, traffic calming areas, etc.), and vehicle fleet composition (private cars, LDV/HDV, motorbikes, public buses, etc.)
MOMOS is designed to simulate scenarios under different exogenous assumptions related to three domains: technology, energy, policy. Technology mainly refers to innovative vehicle penetration trend and average vehicle fuel consumption by vehicle type. The evolution is inspired to different scenarios, such as the EU Reference scenario 2020 and the EU FitFor55 scenario. Energy trends are mainly related to fuel prices and energy mix for electricity generation. Policy trends include fuel duties and car ownership taxation.
One of the core elements of the MOMOS model is represented by the possibility to select from a wide range of sustainable urban mobility measures and adapt them to the specific study context. The available measures are of different nature and comprehensively cover the range of options that cities currently have available to lead the transition to sustainable urban mobility. Also, their selection has taken into account recent and important European programs and projects such as CIVITAS, ELTIS, EIT, etc.
The policy measures implemented in MOMOS are related to:
For each measure, the input values are used to reflect the base year characteristics of the study area. In case of missing inputs, MOMOS provides pre-set reference values according to the specific geographic/demographic/mobility context. Also, measures are assigned a proper starting year, to take into account the temporal dimension while designing the intervention strategies, as well as a ramp-up period (if relevant), to consider the years required for its full implementation. Finally, each policy is defined and calibrated considering a specific rationale and a series of assumptions.
The outcome of the MOMOS simulation consists of a series of quantitative indicators. Indicators are calculated for each scenario at the simulation’s horizon as well as compared to the values at base year.
The quantitative results are related to three main categories:
The calculation framework
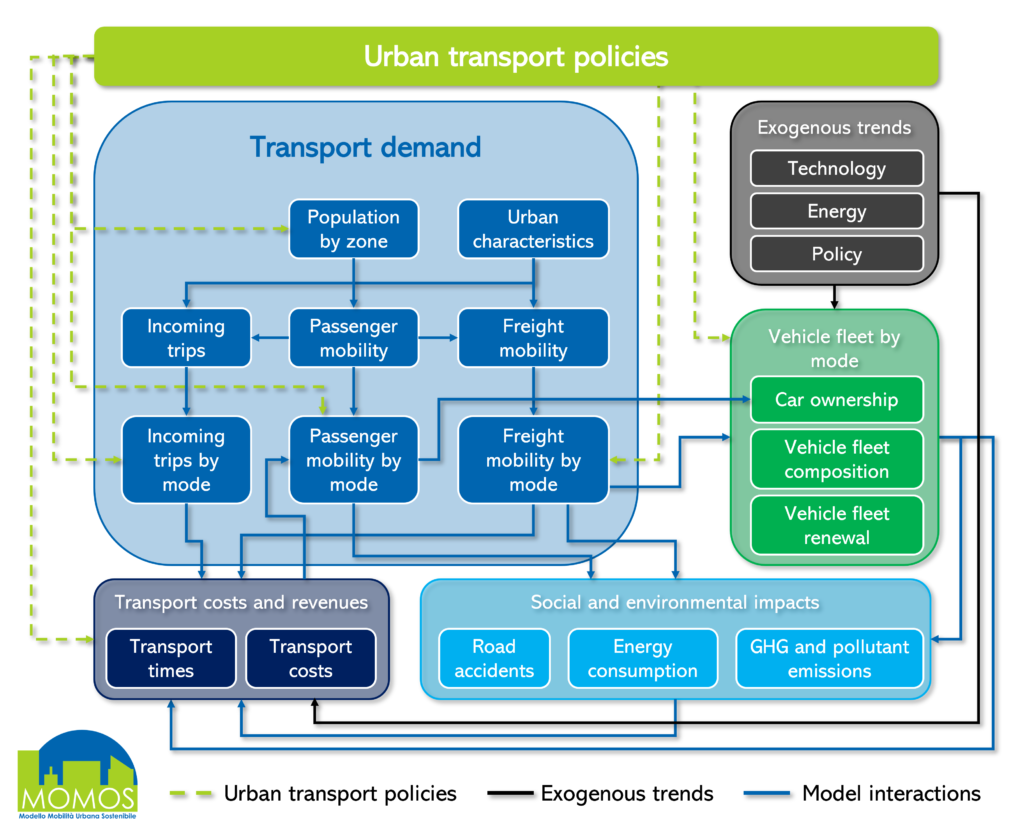
The calculation framework of the MOMOS model consists of several components. The core of the calculation framework consists of i) the component managing the estimation of transport demand for both passenger and freight (trips generated, mode split, passengers-km, tonne-km, etc), complemented with ii) the (road) vehicle fleet component, iii) the one related to transport cost, time and revenues and finally iv) the component where social and environmental impacts are estimated (road accidents, GHG and pollutant emissions and energy consumption). The calculations made within these modules are affected by the urban policy measures selected and set-up for simulating different scenarios. Despite the strategic level of detail of the tool, the definition of specific urban characteristics within the calculation framework allows for a more accurate representation of the urban context, while taking into account also differences that can affect the trend of mobility and especially the impact of the policies.
At spatial level, the urban area is divided into different types of zones generating transport demand. They can be defined with respect to the specific scope of the analysis, considering if the area is a Functional Urban Area or a municipality. Socio-demographic indicators, urbanisation level and accessibility of public transport service are used to define the urban zones.
Trips generated in each zone are distinguished, but without origin-destination details. Within the transport demand component, demographic developments by age group as well as the distribution of the population within the urban area are simulated and used as the main inputs for passenger trips generation. Passenger demand is segmented by purpose considering trips for working (including also education and business) and personal reasons. Furthermore, it is differentiated by period (peak, off-peak) and mode (pedestrian, bike, motorbike, car, bus, tram, metro, car sharing, bike sharing, e-scooter sharing and moped sharing). Mode split at the base year is based on the initial values, modulated within the model by living area (within the urban core and the outskirts with a good level of public transport supply, it is assumed that the mode share of car is lower than in the outskirts with a poor level of public transport supply). Policy measures can change this trend and give rise to mode switches over time. Passenger-km numbers depend on average trip distances. Distances are different according to the living zones (shorter in the core urban area, longer in the outskirts). The estimation of vehicle-km depends on occupancy rates, which can also be affected by policies.


Passenger trips entering the city from other areas are treated separately in the model, because their relevance depends on the nature of the city. The share of multimodal trips (using e.g. public transport at urban level for the last leg of the trip) is explicitly taken into account. Also these trips contribute to the calculation of total passengers-km and vehicle-km by mode in the urban area (only the urban part of the overall trip distance is considered), and therefore affecting travel time, emissions and energy consumption.
Freight traffic in the urban area is considered, evolving over time based on growth rates. Freight demand is modelled considering the category of freight (distribution to retailers, mail services, other e.g. movements of building materials), differentiated by vehicle type (light truck, heavy truck, cargo-bike), and period (peak, off-peak). The model also calculates the transhipments in platform within the urban area, where freight is consolidated and then distributed until destination. From platform, only LDVs and cargo-bikes are used for the last leg of delivery. Finally, performances related to vehicle-km are estimated, considering the urban part of the overall trip distance.


Road vehicle fleets are considered in the model for cars, LDVs, HDVs, buses, moped, car sharing. Vehicles are segmented by fuel type (gasoline, diesel, CNG, LPG, LNG, plugin hybrid electric, battery electric, fuel cells) and emission standard (Pre-Euro and Euro 1/I, Euro 2/II, Euro 3/III, Euro 4/IV, Euro 5/V, Euro 6/VI, and post Euro 6/VI). For some modes only some of the segmentations are available. The car private fleet is distinguished by the car sharing fleet (where it exists).
Road accidents are estimated based on accident rates by mode and applied to the related transport demand performances (vehicles-km). Accidents are differentiated in two categories (fatality, serious injury) according to their severity. The accident rates evolve over time in accordance with mode-specific trends, considering technical developments as well as other circumstances (speed limits, infrastructure quality, etc.) which may arise also from the implementation of policy measures (e.g., traffic calming, infrastructure for pedestrians, etc).


Energy consumption is estimated by fuel / energy type (gasoline, diesel, CNG, LPG, LNG, electricity, hydrogen). Fuel / energy consumption factors are applied to the related transport demand performances (vehicles-km) considering road vehicle fleet composition by engine type. Air pollutant exhaust emissions are estimated for Particulate Matters (PM2.5, PM10), Carbon Oxide (CO), Nitrogen oxides (NOx) and volatile organic compounds (VOC). For PM2.5 and PM10, also emissions from vehicle tyre, brake wear and surface wear are considered. Greenhouse gas emissions (CO2 equivalent) are estimated as well, applying the related carbon content by fuel / energy to the estimated consumption related to transport sector. The model estimates both GHG tank-to-wheel emissions (i.e., only the emissions related to the burning/usage of a fuel in a vehicle) and well-to-wheel emissions (i.e., all the emissions related to the cascade of steps required to produce and distribute the energy carrier, starting from the primary energy resource and including vehicle refuelling. The first ones forecast the direct contribution of urban mobility toward the goal of decarbonisation. The second ones also include the well-to-tank portion of each fuel (production, transport, distribution), which is particularly relevant in the light of the large-scale climatic phenomena.
The model allows to consider in the calculation several exogenous trends related to three domains: technology, energy, policy. Technology mainly refers to innovative vehicle penetration trend and average vehicle fuel consumption by vehicle type. This aspect is relevant for driving the penetration of innovative technologies, influenced only partially by policies at urban level.The evolution inspired to the EU Reference scenario 2020 and the EU FitFor55 scenario are among the options integrated in the model.
Energy trends are mainly related to fuel prices and energy mix for electricity generation. The latter is used to estimate the GHG emissions on Well-to-wheel basis. The energy mix changes over time at the country level according to the exogenous energy trend: among the options, the increase of renewables to achieve the target of 69% as reported in the REPowerEU plan is available.
Policy trends include fuel duties and car ownership taxation.

MOMOS supports the analysis of
pathways towards sustainable urban mobility
The MOMOS model is developed and applied by TRT Trasporti e Territorio.
Contact us to explore the potentiality of this tool.